One of the most pressing challenges that marketers, revenue leaders, salespeople and customer success reps have on their plate today is not a marketing/GTM/ABM/sales challenge, but in fact, it is one of people and change management.
This challenge does not require a new strategy, instead, it needs complete alignment from all revenue departments. While tackling this challenge does demand a few intensive internal sessions, the end result is going to be well worth it.
Our simple spreadsheet helps facilitate this process. This tool can:
- Help C-suite and sales “get demand gen” and marketing.
- Make sure that sales, marketing, and customer success are aligned on all programs.
- Get everyone on the same page about revenue operations in a straightforward, no-nonsense way.
We call it the ‘Revenue Growth Mapping tool’. Let’s dive into what the tool is, and how you can go about using it, but first let’s unlearn a few concepts:
1. Buyer journeys are mapped perfectly with a funnel
Buyer journeys are rarely linear, and yet the classic structure we use to map out buyer journeys is a funnel. As of 2023, funnels are archaic. Presenting to you the bowtie:
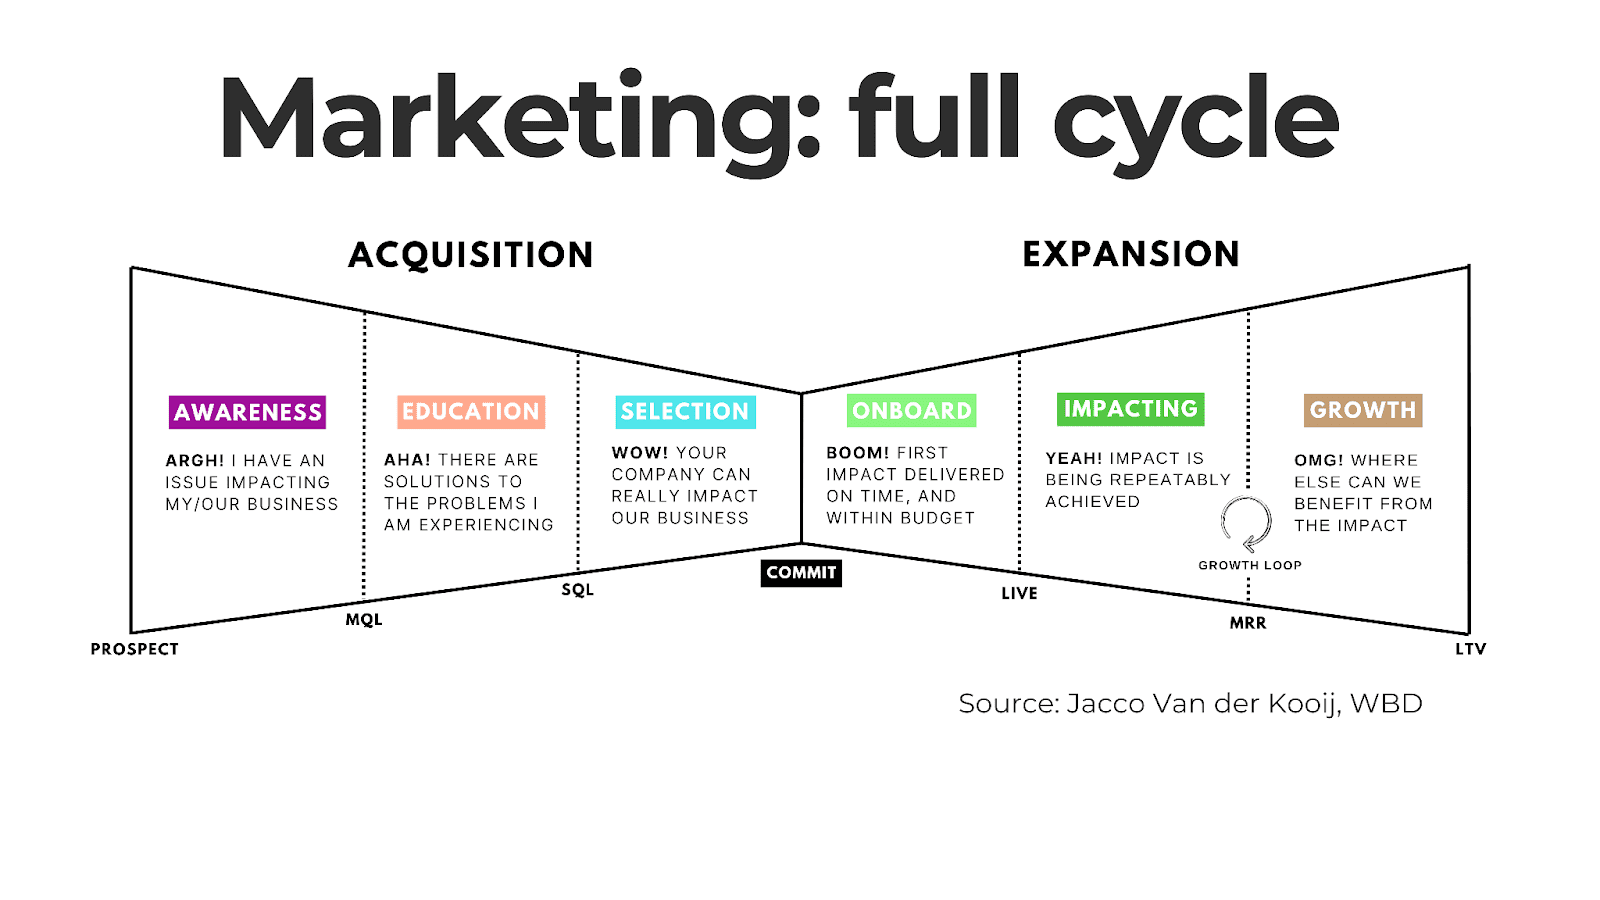
Most of the profit is made in the back end of the bowtie, and yet we are obsessed with following the funnel structure that is inherently short-sighted.
The image above is the best visual representation of how buyer journeys look like, and why marketers should account for not just the stages pre-sales, but also include the latter stages, especially if a huge chunk of your revenue comes from recurring deals.
2. The revenue department includes only sales
Marketing, sales, and customer success (sometimes even product) deserve a seat at the revenue table.
Leaving marketing or customer success out of the picture makes organizations hyper-focus on the “sales” part of the selling process, which is detrimental to marketing led growth.
To start using the tool, you need to familiarize yourself with the top 3 metrics types you should be tracking:
- Brand metrics: these point to positive signals in the right direction. These can include metrics like media invites, website traffic, etc. But, brand metrics on their own do not signal intent, just curiosity.
- Pipeline metrics: these highlight the entrance of an ICP in the pipeline. Here, metrics like engaged accounts and SQLs are tracked and measured.
- Revenue metrics: these include metrics like sales cycle length, average contract length, win rate, etc that point to the impact on revenue because of the “programs” undertaken.
Programs essentially refer to the activities that all departments under the revenue umbrella undertake to boost revenue. We’ve detailed the process of onboarding yourself and your department onto this tool in the video above.
But, unless you experience this first hand, understanding and implementing the tool is a toughie. To get access to the tool and a detailed training on how to use it, you can reach out to us over LinkedIn. We’ll also be answering all audience questions at the training on May 23rd.
Related Posts
- The simple B2B growth-marketing play - ep 3
Can you have success with almost zero marketing? Some believe it’s possible. Up to a…
- Systematic B2B Growth Experiments with Tristan Gillen - ep 23
https://youtu.be/A-LKxj4oBI0 Anyone who’s been in marketing long enough knows that marketing doesn’t run on set…
- Transforming From Sales-led Growth to Marketing-led Growth - ep 38
https://youtu.be/jOKRuhF2gwc At Klear, we’ve been talking a lot about how transitioning from sales-first growth to…